A vegetation-index map is an intermediate measurement product, not a diagnosis simply because its colors resemble a health scale. In a hypothetical large fixed-wing survey, an agricultural client receives a field-wide index layer and asks whether a low-value zone needs intervention. The technical task is to establish what the layer represents before attaching a biological cause or management action to it.
Calibrated bands before index calculation
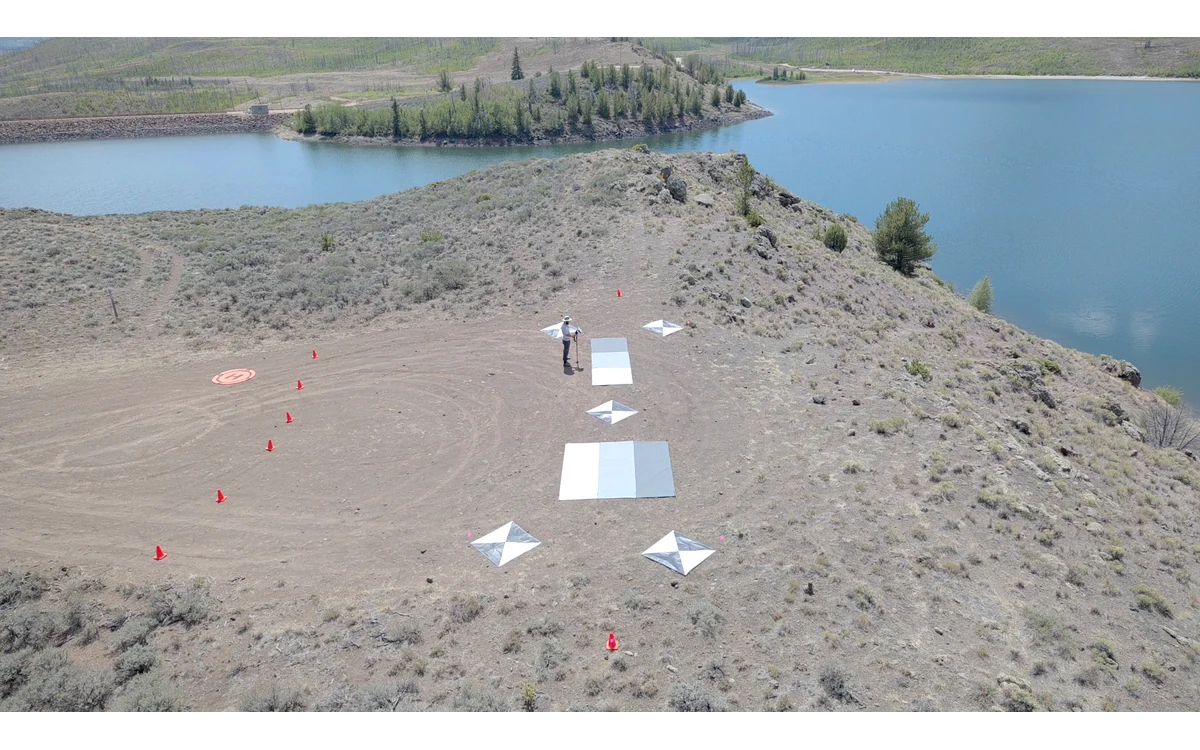
USGS distinguishes raw digital numbers from calibrated quantities such as radiance and reflectance. Its imagery guidance discusses camera corrections, characterized reference panels and documentation of the calibration method. Consequently, an index workflow needs to identify which physical quantities enter the calculation rather than calling every exported raster a reflectance map. [6]
For the hypothetical fixed-wing campaign, the analyst would first inventory band identities, exposure metadata, calibration records and rejected observations. The index definition would be recorded explicitly, including handling of missing or unsuitable values. No index formula or threshold is prescribed here: the appropriate choice depends on the stated agricultural question and its independently validated method.
The RedEdge-MX/DLS 2 guide gives a specific example of an irradiance sensor recording lighting and sun-angle information in image metadata. It also discusses avoiding aircraft shadows and reflections at the light sensor. That documentation supports an installation review for that model, not a promise that an irradiance accessory removes every radiometric effect on a large aircraft. [20]
Geometric and radiometric artifacts
USGS notes that illumination and viewing geometry matter to reflectance and discusses the bidirectional behavior of real surfaces. It also treats geometric calibration separately from radiometric correction. An apparent field pattern should therefore be reviewed against both the calibrated band values and their spatial correspondence. [6]
In the example, the reviewer would ask whether the low-value zone follows a field feature or a processing boundary. Raw frames, original bands and the acquisition sequence would help distinguish a persistent area from a pattern appearing only at a strip join. Abrupt colored outlines would prompt a band-registration check before an agronomic interpretation. These are proposed diagnostic comparisons, not predetermined explanations for any particular pattern.
For long fixed-wing strips, the review would retain changes in acquisition conditions rather than placing the entire sortie under one weather label. The report would say which correction was applied to which observations and where its adequacy was checked. A continuous mosaic should not erase that history.
Field observations and context
The next evidence request concerns the crop and site, not another color ramp. In this hypothetical assessment, field observations would be linked by location and acquisition time to representative index zones. The agronomic reviewer would define what was measured on the ground, how sites were selected and whether observations represent the same conditions as the aerial campaign.
A map-wide statistical association would not, by itself, establish a unique cause at every pixel. The client would need a domain-specific interpretation method and evidence that it applies to this crop, growth stage and management question. None of those project records is supplied here. The defensible output at this stage is a calibrated spectral pattern with documented limitations, not an invented nutrient, disease or yield finding.
State what the index cannot diagnose
USGS recommends carrying calibration information, acquisition context and uncertainty into metadata so later users can judge suitability. The same guidance separates pixel sampling from positional accuracy: a smaller GSD is not a measurement guarantee. [6]
The example handover would distinguish observations, interpretations and decisions. It would identify unsupported areas, name the validation still needed and leave treatment authority with the qualified project decision-maker. A large fixed-wing platform can be part of an agricultural data workflow, but its coverage does not supply missing biological evidence. Until that evidence exists, the index should guide investigation rather than masquerade as a universal crop-health verdict.
Related reading
- Checking Registration Between Multispectral Bands
- Vegetation Monitoring Along Civil Infrastructure Corridors
Sources
- [6] Guidelines for Calibration of Uncrewed Aircraft Systems Imagery
- [20] MicaSense RedEdge-MX and DLS 2 Integration Guide
Visual summary
Concept illustration
Read diagram notes
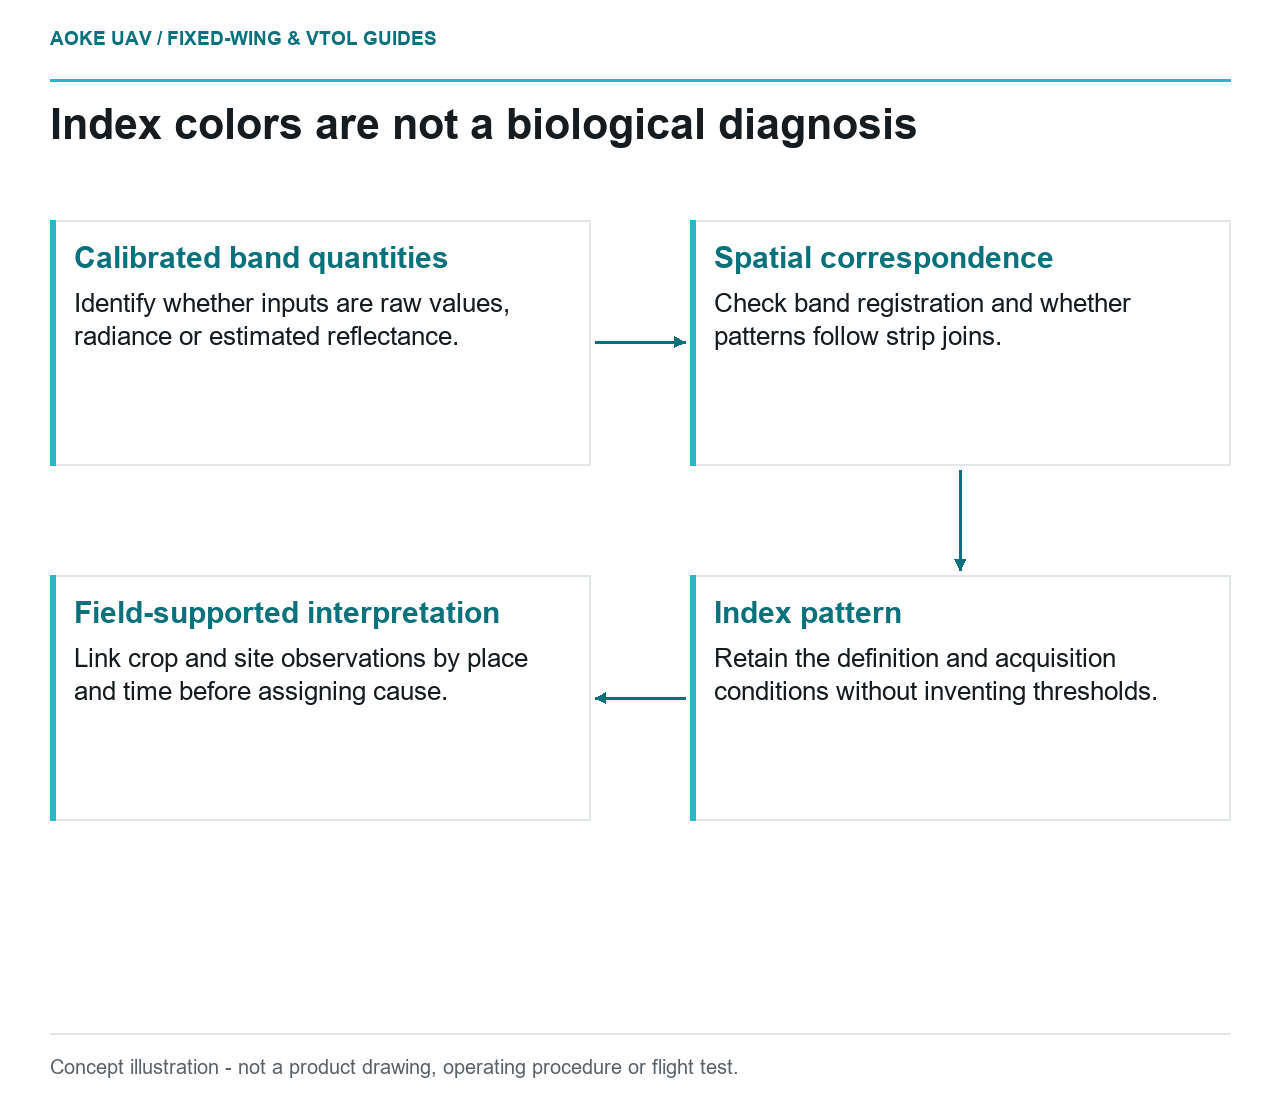
- Calibrated band quantities: Identify whether inputs are raw values, radiance or estimated reflectance.
- Spatial correspondence: Check band registration and whether patterns follow strip joins.
- Index pattern: Retain the definition and acquisition conditions without inventing thresholds.
- Field-supported interpretation: Link crop and site observations by place and time before assigning cause.